Table of contents
Console commands
There are few console commands available in the system to make debugging the game much easier. All of them are prefixed with AdvancedSight so it’s easier to find them using auto complete without having to memorize them.
AdvancedSight.ShouldDebugDrawBasic– use this command to enable or disable debug drawing. Use1or0as a parameter. For example, to enable debug drawing typeAdvancedSight.ShouldDebugDrawBasic 1in the console.AdvancedSight.ShouldDebugDrawAdvanced– use this command to enable or disable advanced debug drawing. Use1or0as a parameter. For example to, to enable debug drawing typeAdvancedSight.ShouldDebugDrawAdvanced 1.AdvancedSight.SelectNextListener– selects next available agent as current target for debug drawing.AdvancedSight.SelectPreviousListener– selects previous available agent as current target for debug drawing.
Basic debug visualization
The plugin comes with extensive debug visualization and data to make sure it is easy for the user to understand what is happening at any given moment inside the system.
Mention about changing/configuring debug colors in the editor settings.
You can pause your game at any given moment in the editor using PAUSE key on your keyboard or by pressing pasue button on the top bar.
If you eject from the player controller using F8 key the debug drawing will disappear. Use ; key instead to switch to debug camera that allows you to move camera freely while keeping the HUD and world debug drawings.
Please keep in mind that even though debug visualization is drawn in 2D, the actual math and all considerations are in 3D space. The 2D debug drawing is solely for simplicity reason because 3D visualization is very hard to understand in most of the cases.
To activate debug drawing you must set console variable in a console prompt which you can activate using ~ key (this can vary based on your local language keyboard layout). Then type the following console command:
AdvancedSight.ShouldDebugDrawBasic 1
The one at the end can be replaced with true as well. To disable debug drawing use the same command but with 0 or false parameter at the end.
The debug tool can only draw visualization for a single agent. System is always selecting agent closest to local player character.
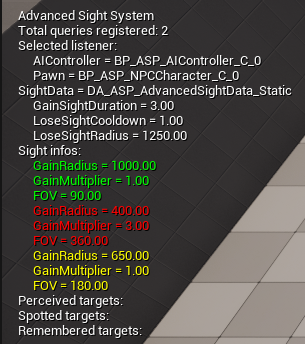
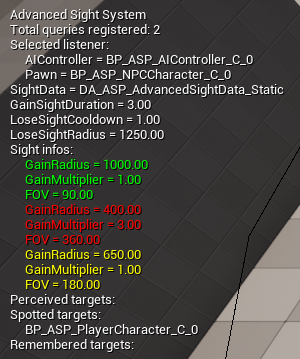
Once debug tool is activated you should see following information in the top left corner:
Starting from the top:
Total queries registered– this one shows how many queries in total are registered in the advanced sight system. These are not queries for selected listenerSelected listener– displays names of selected AI controller and possessed pawnSightData– name of the assigned advanced sight data asset used by the listenerGainSightDuration– value of the property of the same name defined in the advanced sight data assetLoseSightCooldown– value of the property of the same name defined in the advanced sight data assetLoseSightRadius– value of the property of the same name defined in the advanced sight data assetSight infos– shows properties of each sight info defined in the advanced sight data asset. Notice that text color is matching the color of debug drawing visualizing ranges for each sight info visible in screenshots belowPerceived targets– list of currently perceived targetsSpotted targets– list of currently spotted targetsRemembered targets– list of currently remembered targets
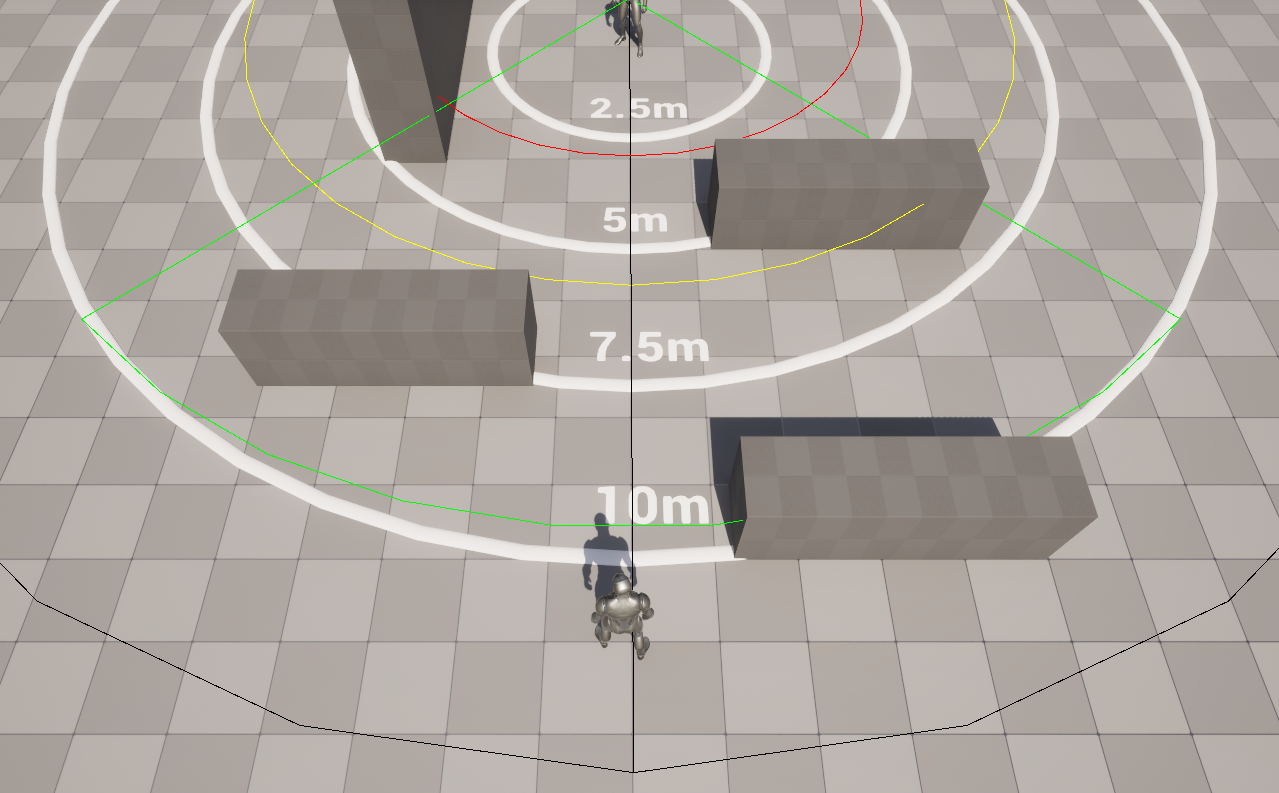
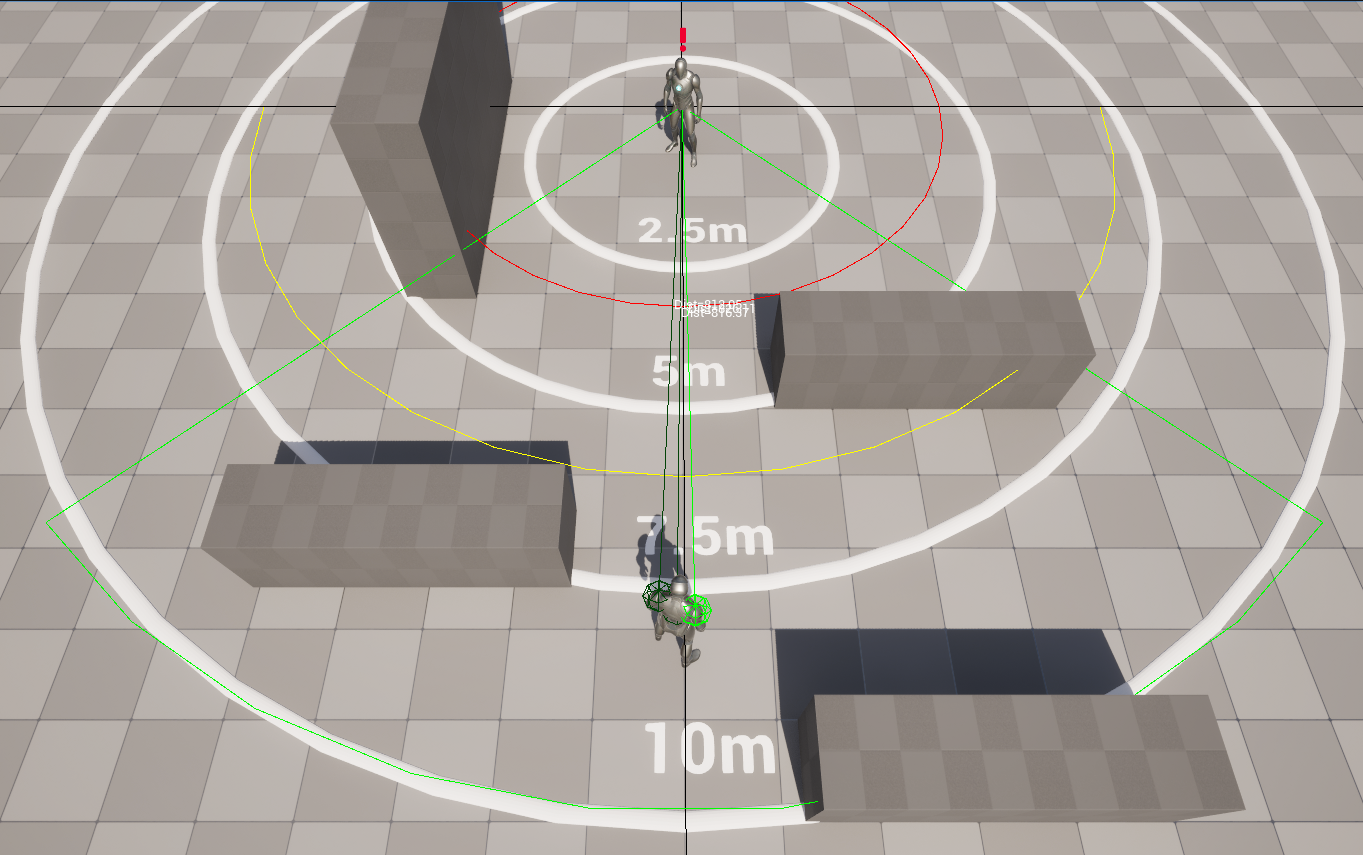
Here we can see debug drawing for each of the defined sight infos in the advanced sight data asset.
Notice that black color is not defined anywhere in the advanced sight data asset. This color is used to visualize sight lose radius and cannot be changed at the moment.
Now, if the player character move closer to the static agent this will happen:
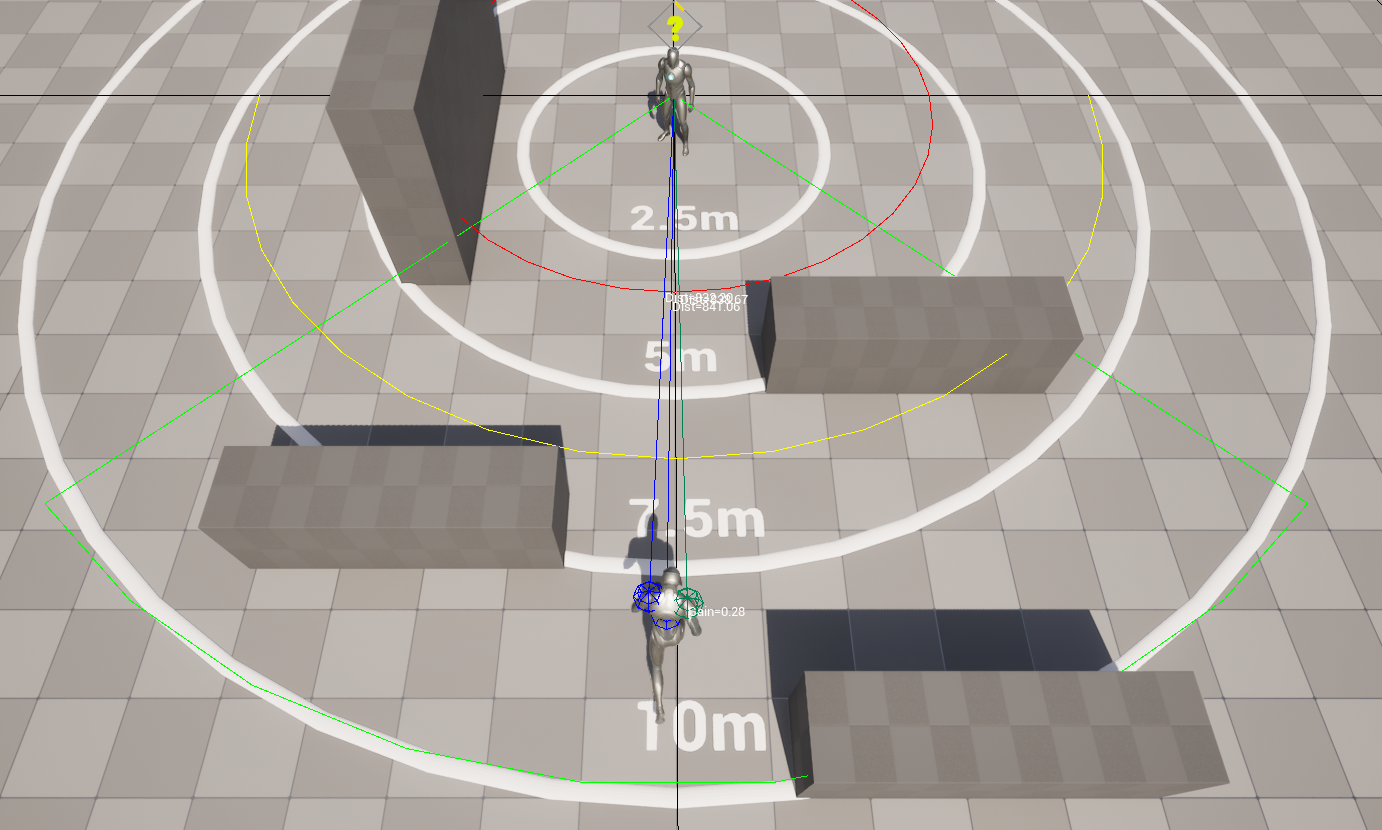
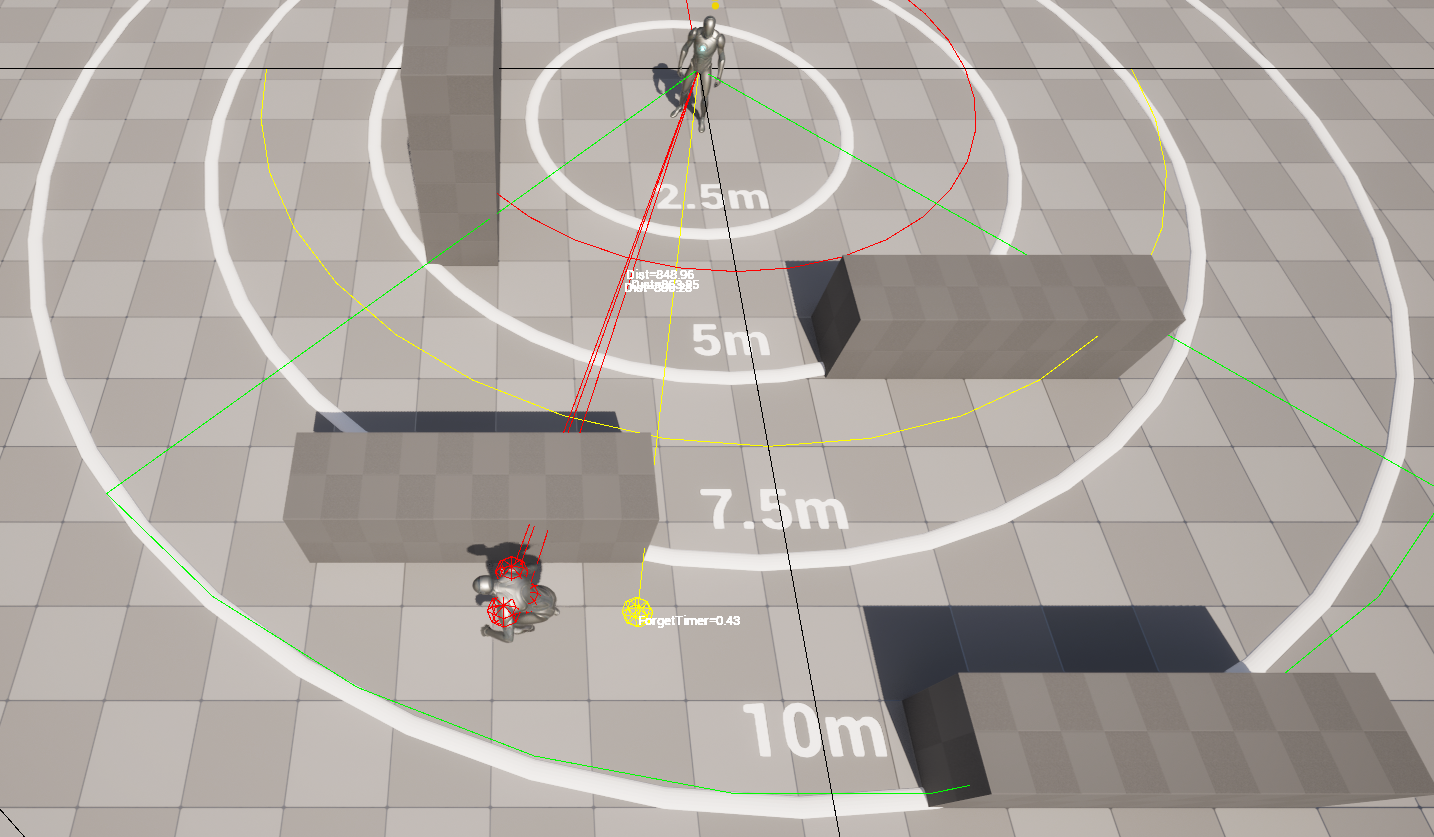
In this screenshot we can see few extra information displayed:
- The three spheres visible on the target character are visualizing visibility points. Their different colors is telling us which of the visibility points actually passed the visibility test. This is because one visibility point passing a test is sufficient for the system to spot a target meaning there is no need for the system to test remaining points. This is why only one of them is green-ish color and the other two are blue.
- Each sphere has a line drawn visualizing line of sight used during testing.
- Each line has a text drawn in the center displaying it’s test distance from the testing agent to the visibility point.
- The sphere that has passed the test has a current gain value drawn. Once gain value threshold is exceeded target transitions from spotted state to perceived state as described at the Overview page.
As you can see below, the list showing spotted targets has also been updated and is now displaying the name of the spotted target’s actor.
Once target actor remains spotted for long enough it transitions to perceived state. Below you can see that the gain value text is no longer visible as it’s irrelevant. The colors of the spheres also changed to match the ones defined in the settings.
Finally, when the target hides and is no longer visible we can see another change:
- The yellow sphere shows the last known location for the target
- Text next to the yellow sphere displays lose sight timer value which once exceeded will cause the target to be forgotten
- Red spheres and lines showing visibility tests that are being executed to verify whether target is visible or not but are failing
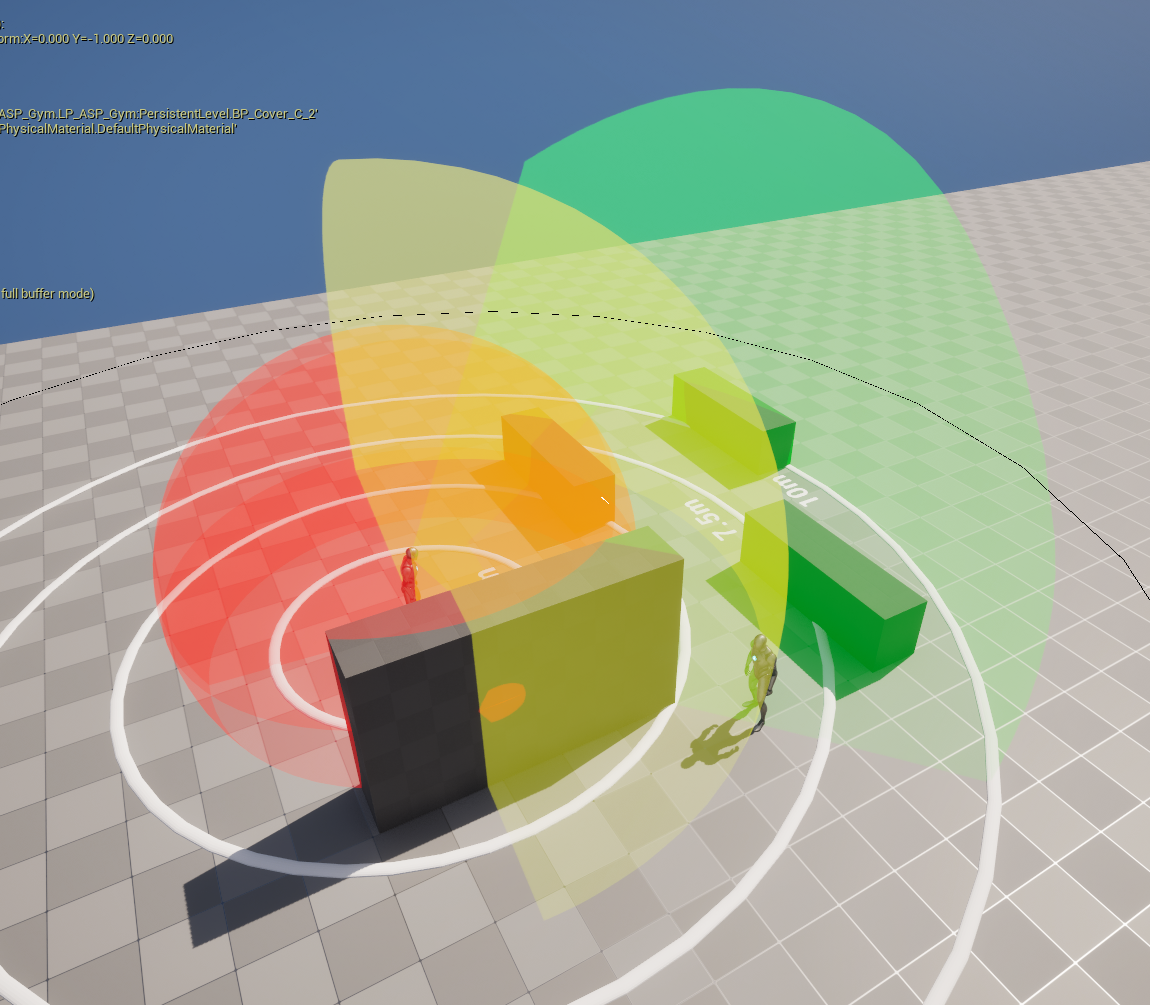
Advanced debug visualization
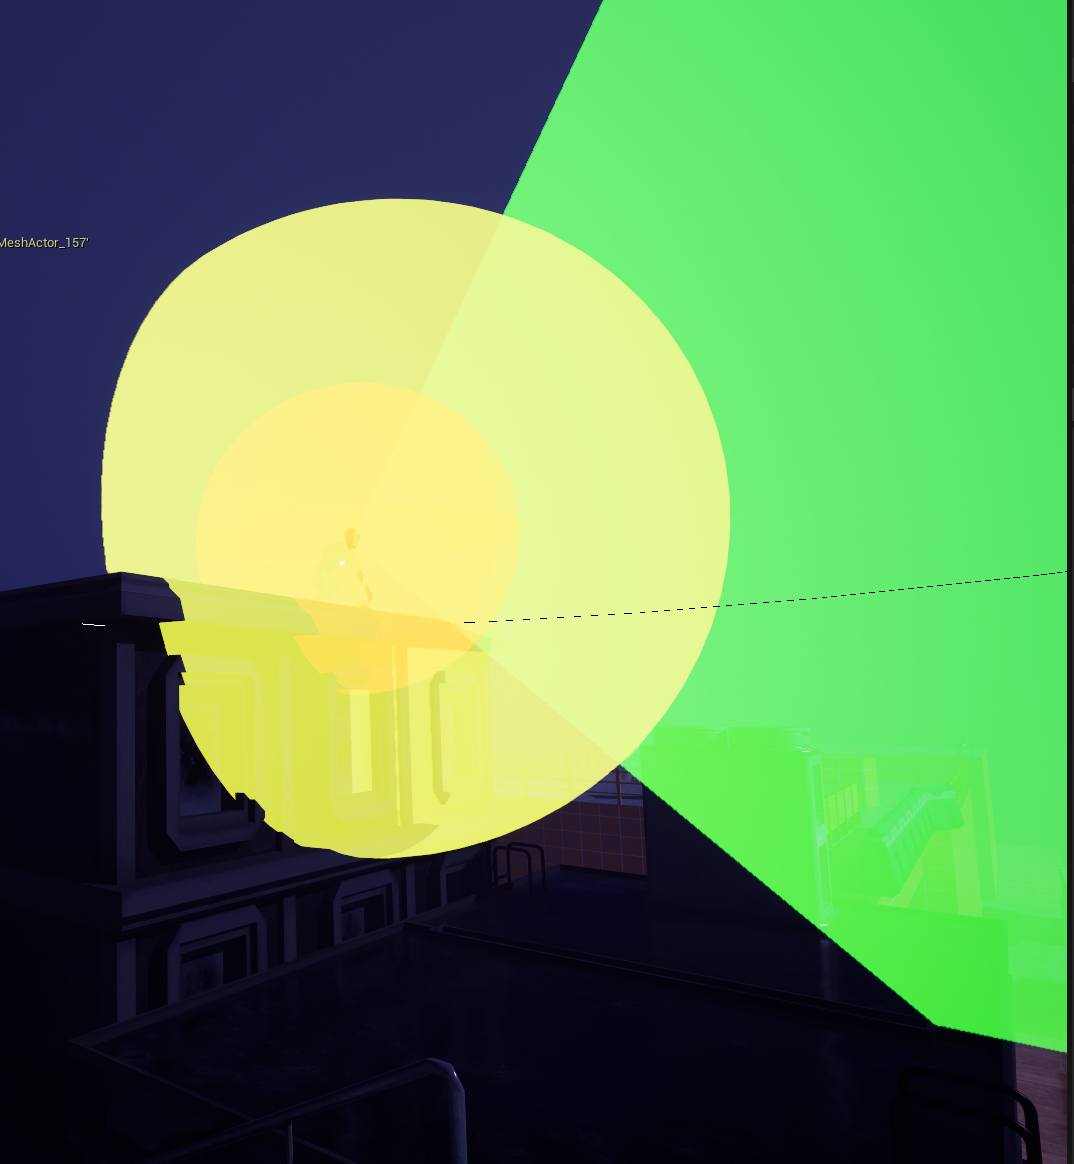
This plugin comes also with advanced debug visualization. It helps to visualize what exactly are the sight ranges for an agent in a 3 dimensional space. It is immensely helpful when your game levels contain some verticality and you would like to inspect which part of the level are covered by a specific agent; whether they can see the space blow or above or not.
To activate this debug drawing mode type AdvancedSight.ShouldDebugDrawAdvanced 1. The following debug drawing should appear on your viewport:
For example, here is an agent standing on a roof. Withtout any visualization it’s hard to determine whether this unit can see what’s happening on a level below.
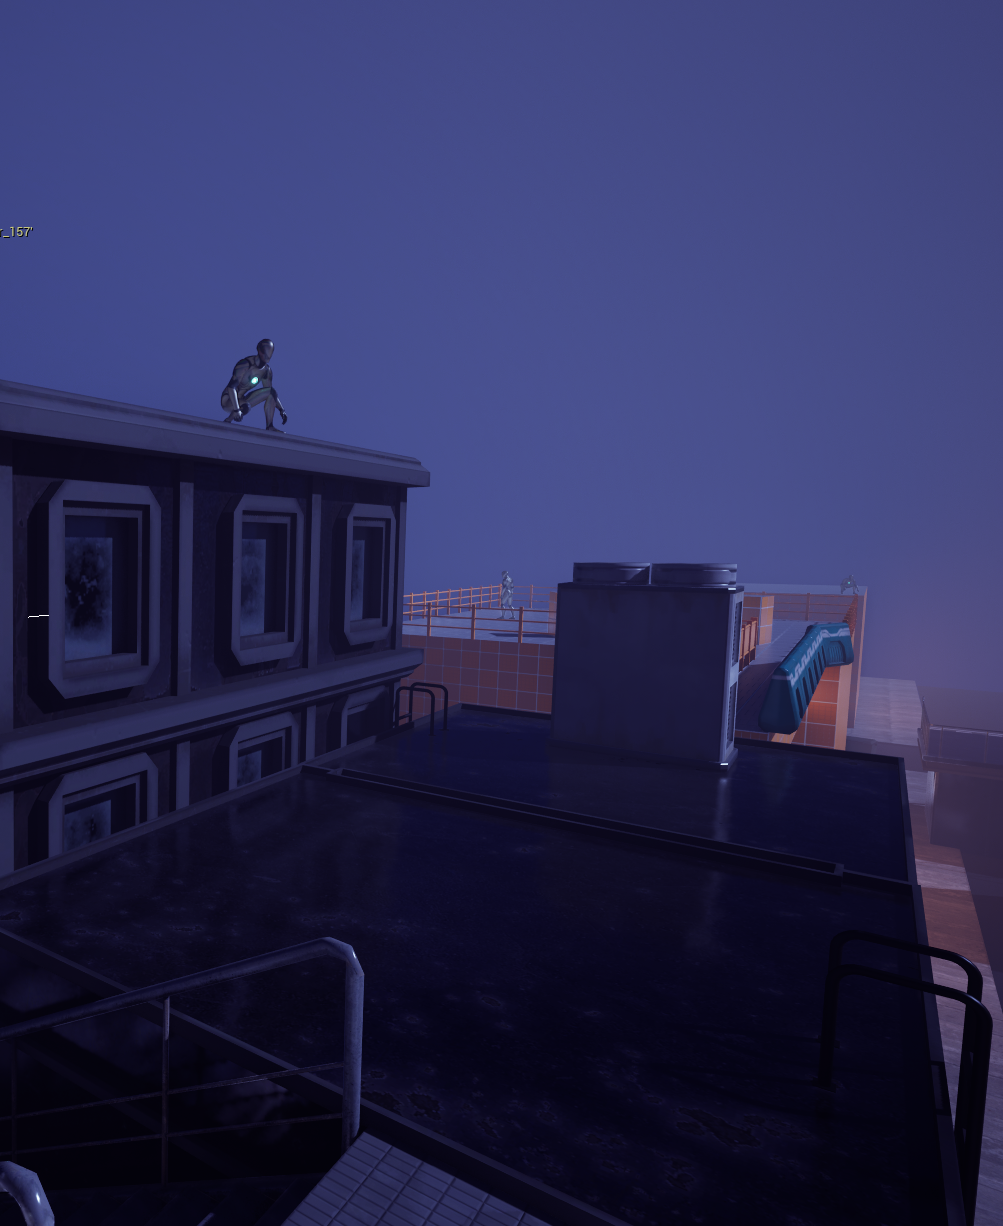
But, with the advanced debugging enabled we can clearly see that it’s not really covering it and adjustments must be made: